Category Position as a Valuation Multiple Driver in SaaS
Market leaders command 2-3x higher multiples than peers with identical growth rates.

Category position has emerged as a key driver of valuation multiples in SaaS. In SaaS, valuation multiples are increasingly determined not just by growth metrics but by category position (whether a company defines its market or competes within someone else's), and understanding this relationship gives founders and investors a lever that financial engineering alone cannot replicate.
Why SaaS multiples reflect position, not just performance
That assumption made sense for a long time. It's also going stale fast.
Aventis Advisors put the public SaaS median EV/Revenue multiple at 4.6x by August 2026, after it had bottomed near 3.2x during the AI disruption sell-off earlier in the year https://aventis-advisors.com/saas-valuation-multiples/ https://multiples.vc/insights/software-saas-valuation-multiples. FE International put public enterprise SaaS trailing-revenue multiples at 3.3x as of the end of March https://www.feinternational.com/blog/saas-valuation-multiples. Compressed medians, across the board.
Except the median is hiding the actual story. Inside that compressed number, the gap between the best-priced companies and the median ones has gotten wider, not narrower. Two companies with identical ARR routinely sell for prices that differ by a factor of three, a gap too large to be a rounding error. That's not a rounding error. A different pricing logic is operating within the same spreadsheet and produces that outcome. The conventional founder assumption holds that multiples are primarily a function of growth rate, ARR scale, and profitability benchmarks.
Public market pricing of category leaders versus category participants
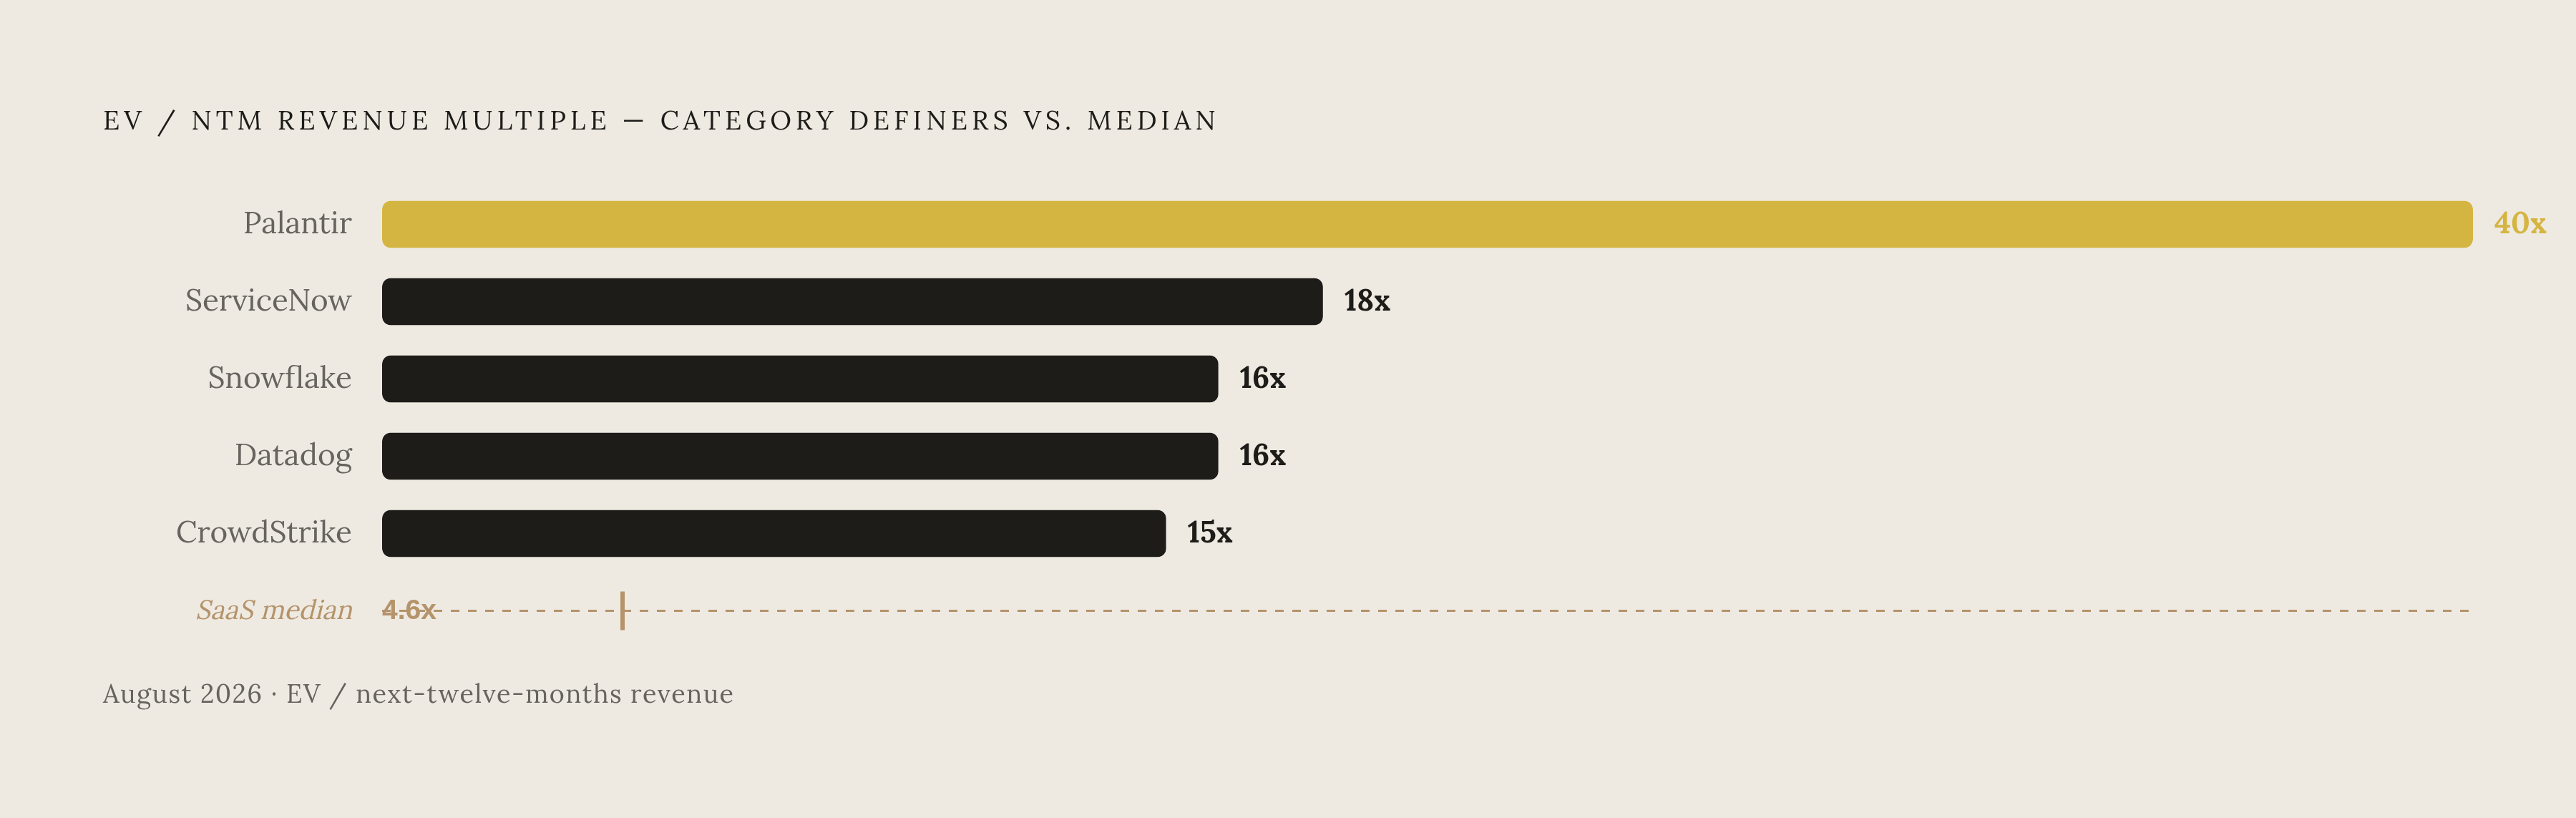
Being ranked #1 or #2 in a large TAM corresponds to trading at 1.5–2x the category average, while being second in a fragmented market carries limited pricing power.
Look at where the premium actually lands. ServiceNow is near 18x, earned by owning the workflow layer inside enterprises that can't function without it https://valueaddvc.com/saas-valuations. Snowflake and Datadog both trade around 16x https://valueaddvc.com/saas-valuations. CrowdStrike, having clawed back from its 2024 outage crisis, trades near 15x on 28.8% growth and a grip on the cybersecurity category that competitors haven't managed to loosen https://windsordrake.com/saas-valuation-multiples/ https://valueaddvc.com/saas-valuations.
None of these companies win purely on size. They win because the market has a settled vocabulary for what each one owns, and that vocabulary doesn't wobble quarter to quarter. Infrastructure SaaS makes the same point at the segment level: Data Infrastructure leads all software categories in multiple, with DevOps close behind at a similar but slightly lower premium. Both are segments where a small handful of companies became the default answer, and defaults get priced like defaults. Palantir trades at approximately 40x NTM revenue, driven by its AI platform narrative and 35% growth.
Category position and how it differs from market share
Market share tells you what already happened. It's a rearview mirror, counting revenue already captured. Category position is a forward-looking claim: what problem does this company own, and whose words does the market use to talk about that problem?
A company can hold real market share in a category somebody else defined, and still get priced like a participant, not a platform. Buyers model participants differently than they model definers, because a participant's growth is bounded by however the category leader decides to move. Category definition means the market speaks your language back to you: your framing of the problem, your name for the fix, your implicit ranking of what matters.
Three signals separate a definer from a participant. Competitors position themselves against you, using your terms, rather than the reverse. Analysts adopt your category name in their coverage without you having to lobby for it. And buyers show up already fluent in your vocabulary, which cuts sales friction and shortens the whole cycle before a rep even says a word.
The three inputs that translate category position into a higher multiple
Three levers turn category position into an actual number on a term sheet, and none of them is "grow faster."
The first is growth runway legibility. Buyers pay for the compounding they can see ahead, not the revenue already booked. A business with $5M ARR inside a $200M niche is running out of room; the identical $5M ARR inside a multibillion-dollar category still has plenty of runway left, and buyers price that gap directly. In 2026, category quality has overtaken category size. A company that's one of many players in a large TAM doesn't get the same premium as a company that's the defining voice in a smaller TAM.
The second lever is switching cost architecture. Category definers tend to earn "system of record" status, and that's not really a technical lock-in, it's a conceptual one. That's why vertical SaaS, where category boundaries are drawn tighter, commands a 25 to 30% premium over horizontal software at comparable performance, thanks to deeper integration, tougher switching costs, and lower churn https://windsordrake.com/saas-valuation-multiples/.
The third lever is narrative credibility with buyers and acquirers. In diligence, if a company can't say what category it owns, why it owns that spot, and what that means competitively, it produces uncertainty. Uncertainty compresses multiples, every time. A sharp category narrative isn't a marketing deck, it's the actual argument a buyer brings to their own investment committee to justify paying up.
AI has made category position more consequential, not less
The AI premium has already gotten picky about who earns it. Palantir at roughly 40x against Zoom at 3.5x is the market drawing that line about as bluntly as it can https://valueaddvc.com/saas-valuations.
But the market has moved past rewarding anyone who simply says "AI" in an earnings call. It now prices AI credibility specifically. Investors reward operational efficiency and AI integration tied to measurable commercial outcomes; thin wrappers slapped on existing product get repriced downward, and fast. Bain reported that one in five strategic buyers walked away from a 2025 deal entirely over AI exposure concerns. Companies with real AI capability earn a 30 to 50% premium over comparable non-AI software; companies faking it don't get a cent of that https://quantpillar.com/resources/guides/valuation-multiples/.
The disruption risk also isn't spread evenly. Sales and Marketing Automation trades at just 1.7x NTM revenue, among the lowest of any software segment, because generative AI threatens to replace the traditional CRM workflow outright rather than just improve it. Design and Engineering Software, by contrast, is at 3.8x, alongside AI-native applications trading near the top of horizontal SaaS, because AI there enhances the core product instead of eating it. Category definers tend to survive this turbulence better, since they own the vocabulary of the problem itself. Even when the underlying technology shifts underneath them, the category name and the market's understanding of what problem it solves tends to stick to whoever defined it first.
Where language drift enters the valuation equation
Early on, go-to-market runs on founder instinct and a handful of people who all sit close enough to overhear each other. It works fine, because everyone's using the same words for the same things without ever having to write them down. Growth changes that quietly, without sending a memo first.
It looks like this once it sets in. Sales describes the category one way, marketing describes it another way, and product has its own internal shorthand that matches neither. Each team optimizes for whatever makes sense locally, and that mismatch produces friction at every handoff between them. The company stops presenting one coherent category claim and starts looking, from the outside, like a participant scattered across several categories at once, which is how buyers end up filing it.
That dysfunction costs real money, visible in the following numbers. CMI's 2025 research on B2B content marketing found 43% of marketers struggle to keep sales and marketing content aligned, 40% cite organizational silos as the culprit, and 42% of the weakest strategies trace back to unclear goals https://therubiconagency.com/technology-marketing-blog/saas-marketing-strategy-alignment/. Those are quantified proxies for what language debt actually costs day to day. Gartner separately found that 74% of B2B buyer teams show unhealthy conflict during their own decision-making, and that same dysfunction occurs on the seller's side of the table too, just with a different cast of characters arguing https://therubiconagency.com/technology-marketing-blog/saas-marketing-strategy-alignment/.
Investors are starting to treat narrative coherence as a diligence signal
Buyers have plenty of capital moving right now. Global deal value climbed 41% year over year to $2.4 trillion in the first five months of 2026, putting the market on pace for its second-best year on record. But that capital has gotten choosier, and choosiness widens the premium for any company that shows up prepared.
Sophisticated buyers now probe for a few specific things in diligence. Can the company state a coherent category claim that holds steady across product, sales, marketing, and leadership, or does the story change depending on who's in the room? Does the market use the company's own language, or does the company borrow the market's language after the fact, since the former signals a definer and the latter signals a participant. And is the AI narrative tied to real commercial outcomes, or is it a wrapper stretched over an existing product with fresher vocabulary?
Research from the Embedding Project, built on four years and over 100 interviews across twenty global companies, found that most organizations run on only three to five dominant internal narratives, and those narratives quietly shape every strategic decision that follows. Buyers who understand this use narrative coherence as a stand-in for management quality and organizational durability, since a company that can't hold one story together internally usually can't hold a market position together externally either. For VC and PE firms, this matters practically: a portfolio company stalling on language rather than product is fixable, but only once someone correctly diagnoses it as a language problem. Mistake it for a product problem, and capital gets misallocated while the exit slips.
Building category position as a deliberate, governed capability rather than a founder instinct
The most common mistake treats category position like a launch event, a rebrand, a press cycle, a shiny new positioning slide, rather than infrastructure that needs upkeep the way a codebase does. A rebrand is a moment. Category position is a maintenance job.
Actual governance in practice means canonical documents that spell out the category claim, the company's spot within it, and the working vocabulary the whole organization runs on, treated as inputs to decisions rather than a brand guideline nobody reads twice. It also means resource allocation, recognition, and leadership behavior all pointing the same direction as the category claim, instead of quietly contradicting it. And it means auditing language consistency across every surface the market touches, sales calls, product docs, analyst briefings, recruiting pages, on a regular cadence, because drift never announces itself and never really stops.
The AI layer raises the stakes on all of this. Large language models get fine-tuned on a company's own data to match its brand voice and domain knowledge. Internal language quality becomes AI output quality directly. A fragmented internal vocabulary fed into that fine-tuning process is not fixed by the model; the model scales it. In any company running AI at real scale, they're the same job wearing two hats. Category leaders trade at 1.5–2x the category average https://valueaddvc.com/saas-valuations. CrowdStrike trades above a 20x revenue multiple https://windsordrake.com/saas-valuation-multiples/. ServiceNow commands a 15–20x revenue multiple range https://windsordrake.com/saas-valuation-multiples/. Palantir trades at approximately 40x NTM revenue https://valueaddvc.com/saas-valuations. Palantir's revenue growth rate stands at 35% https://valueaddvc.com/saas-valuations. SaaS companies with genuine AI integration trade at 1.5–3x the multiple of non-AI peers https://valueaddvc.com/saas-valuations. Embedded fintech revenue can reach 30–40% of total revenue in vertical SaaS https://windsordrake.com/saas-valuation-multiples/. Embedded fintech can achieve 40–60% gross margins in vertical SaaS https://windsordrake.com/saas-valuation-multiples/. A Rule of 40 score above 40 is a practical threshold for premium pricing https://www.l40.com/insights/saas-multiples. 67% of organizations worldwide already use LLMs in their operations https://simo-online.com/en/blog/ai-llm-large-language-models-unternehmen-einsatz-2026. Gartner predicts that by the end of 2026, 80% of enterprises will run generative AI applications in production https://simo-online.com/en/blog/ai-llm-large-language-models-unternehmen-einsatz-2026.
Sources
- SaaS Valuation Multiples 2026: Private Deal Benchmarks | FE International
- Public Software Valuation Multiples — September 2026 - Multiples.vc - Public Comps and Valuation Multiples
- SaaS Valuation Multiples: 2015-2026 – Aventis Advisors
- SaaS Multiples 2026: The Real Private Range (4x to 9x ARR) | L40°
- 2026 SaaS Valuation Multiples by ARR Band | Windsor Drake
- SaaS Valuation Multiples 2026: 8.5x Median, 2020–2026 History
- quantpillar.com